
Macro Linkages

CNY Fluctuation and Equipment Import Costs: The Sensitivity Test
Currency movements can look distant from the factory floor, but for China's semiconductor industry, changes in the value of the Chinese yuan can quickly become a practical cost issue. Semiconductor manufacturing depends on sophisticated equipment, materials, components, software, and technical services sourced from a global supply chain.

VIX Spikes and Semi Stock Defense: The Portfolio Strategy
Semiconductor stocks have become one of the most important expressions of the global technology cycle, but their strong growth characteristics also make them particularly sensitive to changes in financial-market conditions. When volatility suddenly rises, semiconductor equities can experience sharp price movements even when the underlying business outlook has not changed materially.

Copper and Palladium Prices: The Semi Manufacturing Cost Transmission
Semiconductor manufacturing is often described through advanced lithography, wafer fabrication, packaging technology, and massive investments in computing infrastructure. Yet beneath these sophisticated processes lies a less glamorous but highly important layer: raw materials and industrial inputs. Copper and palladium are two commodities that can provide useful signals about this underlying cost structure.

Credit Impulse and Semi CapEx: The 6-Month Lead
Semiconductor capital expenditure is one of the clearest expressions of confidence in the future of the technology industry. When chip manufacturers increase spending on fabs, equipment, advanced packaging, and production capacity, they are effectively making a multi-year commitment to expected demand. When they cut capital expenditure, the decision often reflects concerns about inventories, pricing, utilization, financing conditions, or the broader economic cycle.

Global M2 and Semi Cycle Bottoms: The Historical Overlap
Semiconductor cycles are often discussed through inventory, capacity utilization, memory pricing, capital expenditure, and end-market demand. Yet beneath these industry-specific indicators sits a broader financial variable: global liquidity. Changes in global M2, broadly interpreted as the amount of money and highly liquid deposits circulating across major economies, can influence the financial environment in which semiconductor companies operate. When liquidity expands, financial conditions may become more supportive for investment and risk assets. When liquidity contracts, valuation multiples, corporate financing, and technology spending can all come under pressure.

DXY and Asian Semiconductor Exports: The Seesaw Effect
The semiconductor industry in Asia sits at the intersection of two powerful forces: global technology demand and global financial conditions. While chipmakers, equipment suppliers, and electronics manufacturers are often analyzed through orders, inventories, utilization rates, and capital expenditure, currency movements can quietly reshape the economics underneath the entire export chain. Among the most influential variables is the U.S. Dollar Index, or DXY.

Treasury Curve Dis-Inversion and Semi Style Rotation
The Treasury yield curve is flashing signals again. Not the kind that make headlines, but the subtle shifts in slope, level, and curvature that professional fixed income traders watch like hawks. And for semiconductor investors, these signals matter more than most realize.

Fed Rate Hike and Chip Stocks: The Demand Anchor Paradox
Federal Reserve rate hikes are traditionally associated with pressure on growth stocks, tighter financial conditions, and weaker demand for economically sensitive products. Semiconductor equities appear particularly vulnerable because the industry combines high capital intensity, cyclical demand, elevated valuation expectations, and a global supply chain that depends heavily on credit and investment. Yet the relationship between higher interest rates and chip stocks is rarely straightforward.

AI Capex Debt Financing: The Rate Sensitivity of Hyperscaler Spending
The rapid expansion of artificial intelligence infrastructure has transformed capital expenditure into one of the most important macro-financial stories in the technology sector. Hyperscale cloud providers and large technology companies are committing enormous amounts of capital to data centers, accelerators, networking equipment, power infrastructure, cooling systems, and advanced storage. While much of this investment is supported by strong operating cash flow, the scale and speed of AI infrastructure spending have increasingly brought debt financing and interest-rate sensitivity into the discussion.

2026 Midterm Elections and Semi Policy Pulse: The Scenario Analysis
The 2026 midterm elections are shaping up to be one of the most consequential votes for the semiconductor industry in recent memory. While political drama dominates headlines, the real story lies in how different electoral outcomes will ripple through financial markets—interest rates, exchange rates, credit spreads, and commodity prices all stand to shift based on who controls Congress.
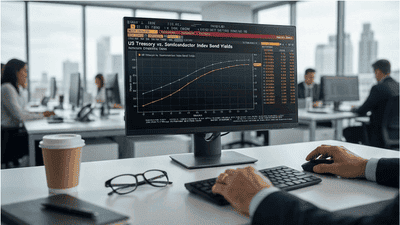
Sovereign Wealth Fund Allocation to Semi Assets: The Rising Trend
Sovereign wealth funds are moving. After years of treating semiconductors as a niche sector play, the world's largest pools of state capital are now allocating meaningful portions of their portfolios to semiconductor assets—both equity and private market exposure.

10Y Treasury Yield vs. Semi Valuations: The Critical Threshold
The relationship between the 10-year U.S. Treasury yield and semiconductor valuations has become one of the most closely watched macro-financial linkages in the technology market. Semiconductor companies are often valued on expectations of future earnings, long-term growth, technological leadership, and expanding demand from areas such as artificial intelligence, cloud computing, advanced networking, and automotive electronics. At the same time, those future cash flows are discounted against a market interest-rate environment that can change rapidly.

A Quarterly Tracking Framework for Semi Buyback Scale and FCF Yield
Semiconductor stocks sit at the intersection of two moving targets: who is buying them, and what their cash flows are worth in a changing macro environment. In one quarter, large institutions dominate flows and free cash flow (FCF) yields look attractive versus bond yields. In another, retail flows surge, multiples expand, and FCF yields compress as rates rise. If you want to understand where you are in the cycle—not just price, but positioning and valuation—you need a framework that connects buyer scale and FCF yield to the macro levers of interest rates, exchange rates, credit, and commodities.

Quantifying the Seesaw Effect Between DXY and Asian Semiconductor Exports
The global chip trade lives on a currency axis. On one side sits the U.S. dollar, measured by the DXY index; on the other side sit Asia’s semiconductor exporters—Korea, Taiwan, Singapore, Malaysia, and others—selling integrated circuits, memory, and logic chips into a world that mostly pays in dollars. When the dollar strengthens, something usually gives. When it weakens, something else usually accelerates. The pattern has become familiar enough that people talk about a “seesaw” between DXY and Asian semiconductor exports.

Synchronicity Regression Test Between Global Manufacturing PMI and Semi Orders
Semiconductors are the nervous system of modern manufacturing. Whether it’s automobiles, industrial machinery, consumer electronics, or data center infrastructure, semi orders reflect what global factories think about the future. At the same time, global manufacturing PMI (Purchasing Managers’ Index) is one of the most watched barometers of industrial health. It’s natural to ask: how synchronized are these two measures? Do manufacturing PMIs and semi orders move together, or do they diverge in ways that matter for investors and policymakers?

The Inverse Relationship Between Mutual Funds’ Overweight Ratio in Semis and Forward Returns
Every cycle has its darlings. In recent years, semiconductor stocks have often played that role, riding the wave of digitization, cloud computing, artificial intelligence, and the endless need for more processing power. Mutual funds, hungry for performance and eager not to miss the next big thing, frequently pile into semis, pushing their portfolio weights well above benchmark levels. Yet a recurring pattern tends to show up: when mutual funds collectively become heavily overweight in semiconductor names, the sector’s forward returns often disappoint.

The Chain Reaction of BOJ Rate Hikes on Yen Financing Costs for Equipment Giants
For decades, Japan’s big equipment makers—tool builders for chips, industrial robots, precision machinery—operated in a world where money in yen was effectively free. Zero or negative rates turned local borrowing into a quiet structural advantage. That world is changing. As the Bank of Japan (BOJ) lifts rates off the floor, the entire chain of yen financing costs moves: from short‑term loans and corporate bonds to global carry trades, FX, and commodity exposures. For equipment giants, this isn’t a footnote. It’s a rewiring of their financial environment.

5-Year Rolling Beta Trends of the Semi Sector vs. Nasdaq 100
Semiconductors and the Nasdaq 100 have grown up together in the public imagination as the heartbeat of modern technology markets. But inside a portfolio, they are not the same thing. One is a concentrated, cyclical slice of the tech hardware stack; the other is a diversified basket of mega-cap growth, platforms, software, and chips. Over time, the way the semi sector moves relative to the Nasdaq 100—its beta—has shifted with macro regimes, interest rate cycles, credit conditions, and commodity dynamics. Understanding those 5‑year rolling beta trends can turn a macro curiosity into a practical risk tool.

Asymmetric Semi-Crude Correlation: Upside vs. Downside Subsample Analysis
Semiconductor equities rarely move in isolation. Their returns are entangled with macro variables: interest rates, exchange rates, credit spreads, and commodity cycles. Yet the way these linkages show up is not symmetrical. When semis rally, their correlation with macro drivers looks different than when they sell off. Upside and downside markets carry different stories about how the sector interacts with financial conditions. An asymmetric correlation lens—separating upside and downside subsamples—helps uncover those differences.

Quarterly Changes in Global Systemically Important Banks’ Credit Policies for Semis
Semiconductors have moved from a niche industry to the backbone of the global economy. Chips power everything from smartphones and cars to data centers and industrial robots. Behind that impressive hardware, however, sits a quieter but equally important structure: the flow of credit that finances fabs, equipment, inventory, and research. At the center of this structure are Global Systemically Important Banks (G-SIBs), whose quarterly changes in credit policies can subtly, and sometimes not so subtly, reshape the semiconductor landscape.

The Historical High Overlap of Global M2 Growth Inflection and Semi Cycle Bottoms
Semiconductors live in a world of wafers and nodes, but their cycles are written in liquidity as much as in silicon. Over the past few decades, chip busts and booms have tracked not just demand for phones or servers, but swings in global money supply. One of the more intriguing patterns macro investors like to point to is the high overlap between turning points in global M2 growth and bottoms in the semiconductor cycle. When broad money growth stops falling and starts to turn up—“growth reflection”—semi sales and valuations often find their floor not long afterwards.

Historical Performance and Coping Strategies of Semis Under "Stagflation" Scenarios
Stagflation—an uncomfortable mix of persistent inflation and sluggish growth—is the kind of macro regime that makes almost every asset class nervous. For semiconductors, it’s especially tricky. The sector thrives on strong end demand, predictable capex, and manageable input costs. Stagflation undermines all three at once: rates stay high, consumer and industrial demand soften, and commodities can bite margins. Yet semis are not doomed in such environments. History suggests they navigate stagflation with a mix of pricing power, capital discipline, and strategic repositioning.

Historical Win-Rate and Odds of the Semi Sector After Fed Rate Cut Cycles Begin
When the Federal Reserve pivots from raising rates to cutting them, everyone asks the same question: what happens to stocks now? More specifically, in the AI era, investors ask: what happens to semiconductors? Are they a reliable winner after the first cut, or does the sector’s cyclicality and high valuation risk turn the easing phase into a coin toss? History doesn’t give us a perfect script, but it does offer patterns—and those patterns give us a way to think about win rates and odds, rather than stories alone.

Sovereign Wealth Funds’ Rising Allocation Ratios to Strategic Semi Assets
Sovereign wealth funds (SWFs) live at the intersection of politics, macroeconomics, and long‑term investing. They exist to turn national surpluses—often sourced from commodities, exports, or foreign exchange reserves—into enduring wealth. In the 2020s, one asset class has moved from “interesting” to “strategic” in that mission: semiconductors. Chips are now seen as part of national security and industrial policy as much as financial opportunity. That shift has forced SWFs to think hard about how much risk they are willing to allocate to semi assets, and how that allocation fits into a world of changing interest rates, exchange rates, credit cycles, and commodity prices.
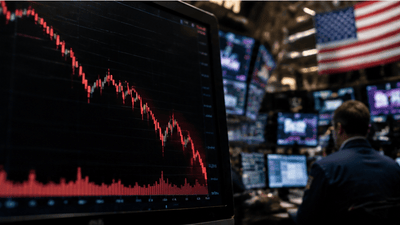
Drawdown Magnitude and Recovery Duration of Semis During USD Liquidity Crises
Semiconductor stocks have a habit of reminding investors that progress is not a straight line. Periods of explosive growth, fueled by new technologies and insatiable demand for chips, are often followed by brutal drawdowns when the macro environment turns. Among the most stressful of these episodes are USD liquidity crises—moments when dollar funding dries up, credit spreads widen, and global markets scramble for access to the world’s reserve currency. In those periods, the magnitude of semiconductor drawdowns and the duration of their recoveries tend to reflect not just sector-specific forces, but the broader macro linkage of interest rates, exchange rates, credit conditions, and commodities.

Semi Style Rotation Patterns During the Treasury Curve Dis-Inversion Period
When the US Treasury curve inverts—short‑term yields rising above long‑term yields—it doesn’t just spook bond investors. It quietly rewrites how equity sectors trade, including semiconductors. An inverted curve is a signal about future growth, funding costs, and recession risk. Semi stocks, with their mix of cyclical exposure and long‑duration growth narratives, respond in distinct ways. Within the sector, “style” rotation—between growth vs value, large vs small, equipment vs device makers—often emerges as investors reposition for a different macro regime.

Sensitivity Stress Test of CNY Fluctuations on Domestic Equipment Import Costs
Exchange rates are often discussed as abstract macro variables, but for firms that import equipment they show up as very concrete line items: higher or lower invoice amounts, changed project budgets, revisions to CapEx plans. In China, where many of the most advanced production tools and capital goods are still imported and priced in foreign currencies—especially dollars, euros, and yen—fluctuations in the renminbi (CNY) can have a direct and sometimes material impact on domestic equipment import costs.

Estimating the Pulse Effect of Post-2026 US Midterm Election Policy Expectations on Semis
Midterm elections don’t manufacture a single chip, but they can move the pulse of the entire semiconductor complex—through budgets, export controls, tax incentives, and energy policy. In 2026, that pulse is particularly important. AI, data centers, and onshoring drives have put semis at the center of U.S. industrial and security strategies. When investors look past the vote to what policy might come next, they’re not just guessing about politics; they’re re‑pricing interest rates, exchange rates, credit risk, and commodity demand. The question is: how do we estimate the pulse effect of post‑2026 US midterm election policy expectations on semis in a macro-linked way?
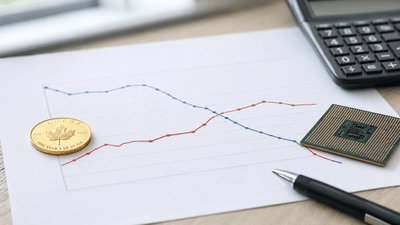
The Disappearance of Gold-Semi Negative Correlation During Crisis Periods
For years, gold and equities—especially high‑beta sectors like semiconductors—were seen as opposites in a portfolio. Gold was the safe haven; semis were the growth engine. When risk assets sold off, gold was supposed to rise, offering protection. When growth surged, gold might lag while semis rallied. That simple negative correlation made intuitive sense. Then crisis periods started to complicate the picture. In more recent shocks, gold and semis have sometimes moved together, or at least failed to deliver the clean inverse dance many investors expected.

The Complete Price Transmission Path from Commodities (Cu/Pd/Si) to Semi Manufacturing Costs
Semiconductors look like pure technology from the outside: nanometer nodes, transistor counts, AI performance metrics. Underneath the clean diagrams sits a very physical reality. Chips are built out of commodities—copper (Cu), palladium (Pd), silicon (Si), along with many others—and every move in those upstream markets eventually shows up in manufacturing costs. The transmission isn’t instant; it snakes through purification, wafers, interconnects, packaging, and energy before arriving at the P&L of a fab or a memory manufacturer.

Defensive Portfolio Strategies for Semi Stocks During VIX Spikes
Semiconductor stocks live at the intersection of technology excitement and macro stress. They benefit from long-term growth in AI, cloud, and electrification, but they also sit among the first sectors to get hit when volatility spikes. The VIX—the so‑called “fear index”—is a quick gauge of that stress. When it surges, correlation rises, liquidity can dry up, and cyclicals like semis often move sharply. Yet volatility episodes don’t have to turn into permanent damage for semi-heavy portfolios if you have a defensive playbook ready.

Impact of Narrowing US-China Yield Spreads on Net Foreign Capital Flows into Semi Sector
Yield spreads don’t manufacture a single chip, but they help decide who pays for the next fab and who doesn’t. For global investors, the difference between US and China government bond yields is a quiet steering wheel: when the spread is wide, capital leans one way; when it narrows, flows start to recalibrate. In 2020s markets—where semiconductors sit at the center of technology, trade, and policy—that steering wheel matters a great deal for where foreign capital lands inside the semi ecosystem.

6-Month Lead Validation of China’s Credit Impulse Indicator on Semi CapEx
Macro linkages rarely move in straight lines, but some signals consistently show up ahead of the cycle. China’s credit impulse is one of them. It has long been treated as a leading indicator for global manufacturing, commodities, and emerging markets. Increasingly, investors are asking a more specific question: does China’s credit impulse also lead semiconductor capital expenditure, and if so, by how much? The hypothesis many macro desks now test is a 6‑month lead—a forward window where changes in credit impulse foreshadow shifts in semi CapEx.

IPO Heat in the Semi Sector as a Contrarian Sentiment Indicator – Historical Validation
In every cycle, there comes a moment when semiconductor stories feel effortless. Order books are full, AI headlines are everywhere, valuations stretch, and suddenly a cluster of semi-related companies decides it is the perfect time to go public. That moment—call it “IPO heat”—is often treated as a sign of strength. Historically, it has also been a subtle warning flag: when the semi IPO market gets too hot, future returns in the sector often cool.

The Tiered Impact of Fed Balance Sheet Reduction on Semi Liquidity Conditions
When the Federal Reserve shrinks its balance sheet—moving from quantitative easing (QE) to quantitative tightening (QT)—it doesn’t announce anything about semiconductors. It talks about reserves, Treasuries, and mortgage‑backed securities. Yet the ripple effects of that decision run all the way out to sectors like semis, which depend on liquidity for valuations, funding, and cyclical demand. The impact is not uniform; it’s tiered. Large, cash‑rich chipmakers feel QT differently than small caps, equipment suppliers, and speculative AI plays.

A Long-Short Strategy Framework for Semi Stocks During CPI Surprises
Inflation prints used to be background noise for semiconductor investors. Now, Consumer Price Index (CPI) days feel like event risk for the entire market. A hotter‑than‑expected CPI can send rates higher, the dollar stronger, credit spreads wider, and cyclicals—including semis—sharply lower. A cooler print can do the opposite, unleashing rallies in duration‑sensitive sectors. In that environment, the semi sector doesn’t just trade on earnings and AI narratives; it trades on macro surprises.

The Impact of Offshore CNY Liquidity Tightening on HK-Listed Semi Valuations
Hong Kong has become a crucial bridge between mainland China’s capital and global semiconductor markets. Funds managed out of HK often hold stakes in chip designers, foundries, and equipment suppliers across Greater China and beyond, funded partly by offshore renminbi (CNH) and multi‑currency capital pools. When offshore CNY liquidity tightens—through weaker CNH funding, tighter cross‑border controls, or higher offshore rates—the bridge narrows. That narrowing doesn’t just affect FX traders; it can ripple into how semi assets are valued and financed in HK portfolios.

The Correlation Between Credit Spreads (HY OAS) and Financing Costs for Small-Cap Semis
Small cap semiconductor companies live in a different financial universe than their mega‑cap peers. They don’t issue vast tranches of low‑cost bonds or tap equity markets at will. Instead, they often sit closer to the high‑yield (HY) credit world, where option‑adjusted spreads (OAS) over Treasuries tell you how much the market charges for default risk. When HY OAS widens, the price of money rises for these firms, and the runway for growth shortens. When HY spreads compress, financing becomes more accessible and expansion stories feel more credible.

2026-2027 Macro Scenario Analysis – Semi Allocation Under Soft Landing, Hard Landing, and No Landing
Semiconductors now sit at the center of the global macro story. They are not just a “tech sector” anymore; they are the physical backbone of artificial intelligence, cloud computing, industrial automation, defense systems, and consumer electronics. That makes semi allocation decisions in 2026–2027 inseparable from how we think about interest rates, exchange rates, credit conditions, and commodities across different macro scenarios.

Empirical Evidence on the Critical Threshold of Negative Correlation Between 10Y Yields and Semi Valuations
In macro markets, relationships are often drawn as simple lines: “higher rates hurt growth,” “lower yields boost tech,” “semiconductors like easy money.” Reality is messier. Yet one pattern has become familiar in recent years—when long-term interest rates move beyond certain levels, valuations in high-duration sectors like semiconductors begin to respond in ways that look like mirror images. Stock charts and yield curves start to dance in opposite directions. The correlation turns negative, and for investors living through the AI chip super-cycle, that correlation matters.
Global Risk Sentiment Cycles vs. Semi Equity Fund Positioning
Semiconductor stocks sit near the center of modern equity markets. They’re a direct play on AI, cloud, and digitalization, and at the same time a cyclical bet on global manufacturing and trade. That makes them uniquely sensitive to swings in global risk sentiment—the ebb and flow of investor appetite for risk driven by growth, inflation, liquidity, and geopolitical noise. When sentiment cycles turn, semi equity funds are often among the first to reposition.